Building an open-source Playwright CI debugger. Learned something unexpected about how devs evaluate tools
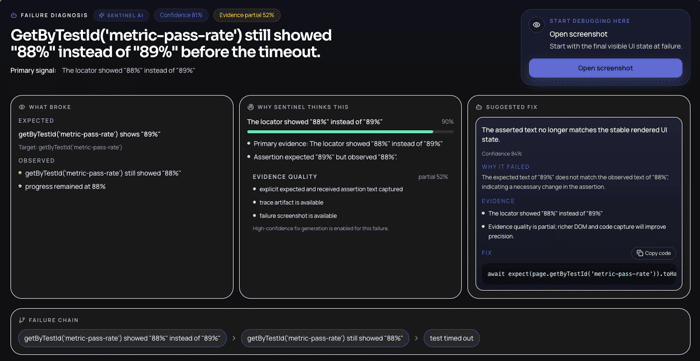
I’ve been building an open-source tool over the past few weeks to make debugging Playwright failures in CI less painful.
The original frustration was simple:
When a test fails in CI, you don’t fix it immediately, you spend time figuring out what actually happened.
Downloading artifacts, opening traces, scanning logs… it’s slow and repetitive.
So I built a tool that:
- aggregates traces, screenshots, videos, and logs into one report
- highlights differences between runs
- groups similar failures
- generates a quick AI summary of what likely broke
Here’s a live example of a failed run:
https://app.sentinelqa.com/share/1f343d91-be17-4c14-b1b9-2d4e8ef448d2
And the open-source repo:
https://github.com/sentinelqa-dev/playwright-ci-debugger
What surprised me
After sharing this in a few places, I noticed something interesting:
People are clicking the example report far more than the GitHub repo.
Which makes sense in hindsight:
→ devs don’t want to read about debugging tools
→ they want to see how it helps them debug faster
Now I’m rethinking how I present this:
- less focus on features
- more focus on “here’s a broken test → here’s how fast you understand it”
Where I could use advice
I’m trying to figure out the best way to grow this early on.
Would you:
- Focus on open-source adoption first (GitHub traction)
- Push the hosted version (Sentinel) as the main entry point
- Double down on demo-driven content (videos, shareable runs)
Also curious:
How are you currently debugging flaky CI tests?
Feels like everyone has a slightly different workflow here.
