How to debug web faster? desktop & mobile
Short answer
Use our browser extension https://rightonpage.dev (no install required to take a free trial)
Do you have any web app or landing page?
Yes?
Then you must check it out, as it will definitely improve your web debugging experience by a lot. How?
1. Desktop browser
Old days:
- You open browser devtools, look for logs in Console, switch to Network to find your request, go to Payload tab, then turn to Response tab. So many clicks and switching tabs!
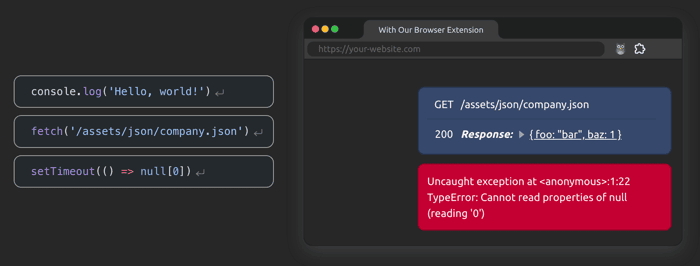
With our Chrome / Firefox / Safari extension:
- You see everything all right on page: logs, request header & payload, response header & body
2. iOS Safari
Old days:
- You take out your Macbook and a USB cable, connect it to your iPhone, open Safari on Macbook, turn on developer feature, find the device and page you want to debug
With our iOS Safari extension:
- You see logs and API requests right on page
- plus, now you can inspect and edit element styles right on page!
3. Snip HTML + CSS of any impressive UI you run into
Old days:
- You inspect each element (could be a ton) of that UI, copy each css style of it
Now:
- Export HTML + CSS with just two clicks
Wrap it up
No install required, try it right on our website: https://rightonpage.dev
I build it becasue I believe:
- Chrome devtools is powerful, but sometimes it's not that user friendly for your most commonly used features. That gap is my opportunity
- Debugging on mobile browsers has always been a pain in the ass.
