Made it through week 2!
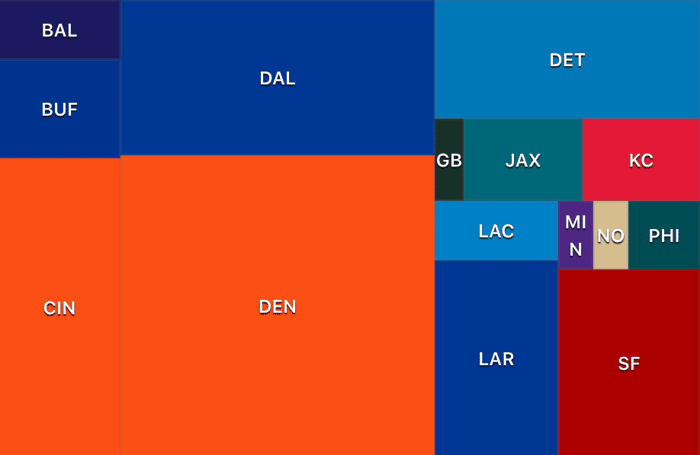
After a sprint to the finish of building sportfolio.money before football season started, things have settled down a bit into seeing how things actually go. Is it fun game? People have been buying and selling and turning their fake $10,000 into more money, and seem to get the gist of how it works.
It occurred to me that there's no reason to buy and hold... so I'm working on that. Maybe something like a tax on gains if you hold for less than a week, but I'm still working out the details in my head. That of course risks making the game too complicated, but maybe that's a good thing...
Features:
- Shipped the share distribution chart on the main page. I want to do something that looked like the chart where each stock is a box sized by market cap. I think it turned out pretty well! (It's the image at the top of this post)
I used the Tree Map chart from Spotify's open source charting library (https://spotify.github.io/reactochart) . Would recommend. The documentation made it a liiiiitle tricky to figure out what data some of the prop functions would be called with but other than that it was pretty smooth sailing. Their example uses d3 to associate values with colors along a gradient, which just didn't look good with my data. I ended up going with the team hex codes instead.
Users:
- 6 so far who I personally asked.
Marketing:
- ? Lol still no idea
