Making Umami actually useful with a quick Grafana dashboard
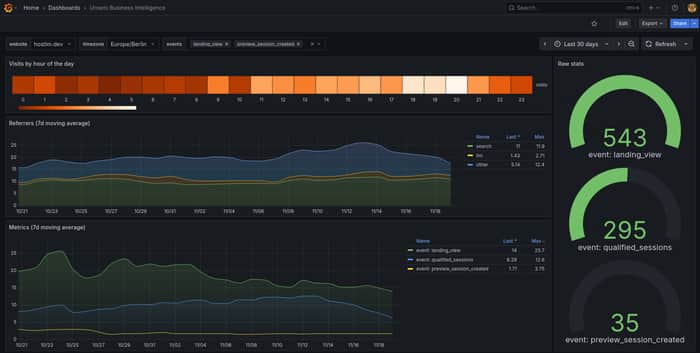
I've been using Umami for analytics on Hostim.dev since the early days. It's lightweight and privacy-friendly, but once you start relying on the data, the default dashboard feels a bit too minimal.
So I hacked together a small Grafana dashboard on top of Umami's PostgreSQL.
Took maybe 10 minutes and added things I actually needed:
- hourly traffic heatmaps
- 7-day moving averages
- bot filtering (qualified sessions only)
- grouped referrers (search, LLM, etc.)
- selectable custom events
The difference is night and day — suddenly the data becomes actionable instead of “nice to look at.”
I wrote a short guide with:
- a ready-to-use Docker Compose stack (Umami + Postgres + Grafana)
- the dashboard import link
- and how to hook it up if you're already using Umami
If you're into self-hosting or analytics, here's the write-up:
https://hostim.dev/blog/umami-grafana-dashboard

Nice improvement — dashboards only become valuable when they change a decision, not just show data.
At this stage, what’s the one insight from this dashboard you expect to influence action most — spotting drop-offs faster, catching anomalies, or prioritizing what to fix next?