We have just improved our analytics.
Starting today users can explore heatmaps for clicks and mousemove, scroll and completion depth among many other data on their resources such as Link In Bio, Forms or Booking Calendars.
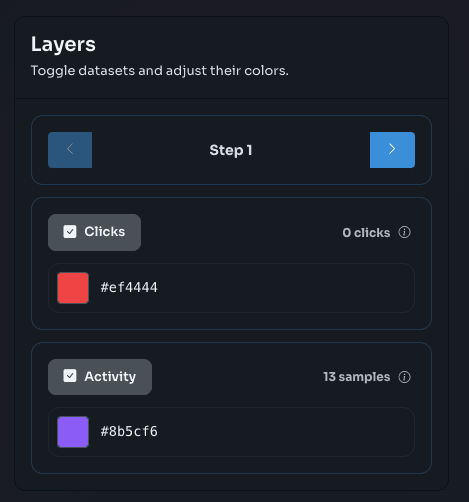
Each step on your Forms or Booking Calendar contains their own heatmap, so you can see behavior patterns and improve your design, layour and communication strategy.


The per-step heatmaps are interesting. I'm curious what surprised you most once you started looking at real user behavior instead of aggregate metrics. Was there anything that challenged an assumption you had about how people were using the product?
Hello Aryan, thank you for your question!
Please feel free to join us on Visualink and experience the analytics by yourself, feedback is always welcome!
As per what I realized, it hasn't been too long since we implemented it but so far I've realized people are clicking quite often on spots where there are no links or CTAs, like specific words in the middle of a text, so we're planning to allow links within texts shortly.
Appreciate the context.
That kind of unexpected behavior is usually where the most useful product insights come from.
Would be good to continue the conversation as you learn more from the data.
What's the best email to reach you on?