What Breaks at Scale in Network Assurance Platforms: A Conversation with Irullappan Irulandi
The network management system market sat at roughly $11.16 billion in 2024 and is on track to reach $27.41 billion by 2033, expanding at a 10.5% compound annual rate that reflects how heavily enterprises now depend on these platforms to keep mission-critical infrastructure running. Telemetry volume has grown faster than the platforms collecting it. A single observability vendor announced in 2025 that it now stores more than 100 petabytes of telemetry data per month, and IT leaders peg the per-minute cost of an outage at $4,537. The harder question, rarely asked publicly, is what it actually takes to keep the systems doing the watching fast enough to keep up.
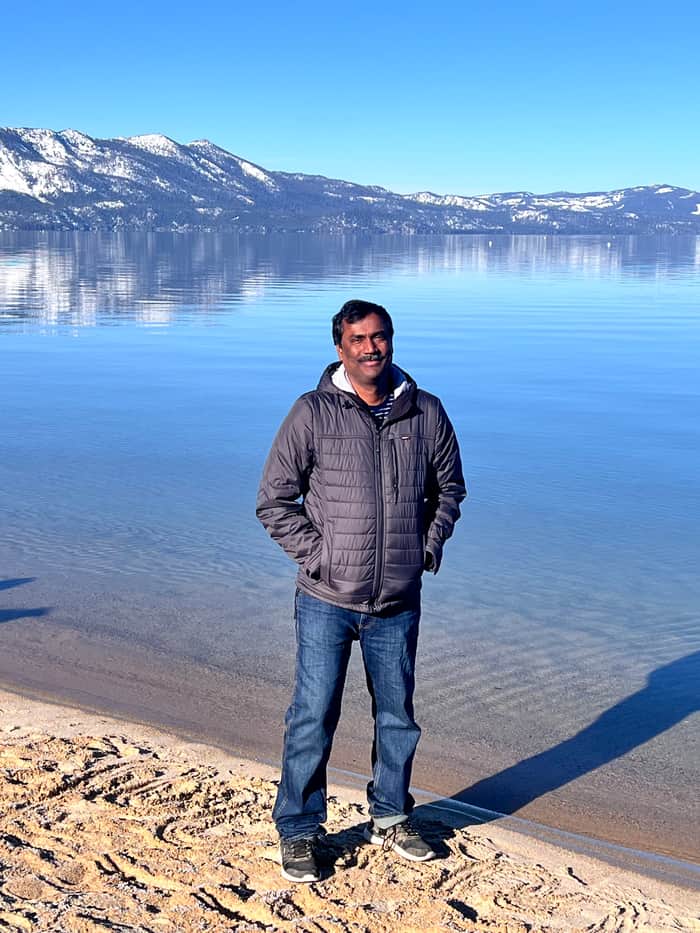
Irullappan Irulandi is an Engineering Technical Leader and IEEE Senior Member with more than 18 years of experience designing and scaling enterprise network management and assurance platforms across SAN, IP, and distributed service environments. His career has put him at the center of the question that keeps enterprise platform teams awake at night: how do you scale the system that watches the network without becoming the bottleneck yourself?
We spoke with Irullappan about telemetry pipelines under load, the failure modes nobody talks about in vendor decks, and what two decades of performance engineering has taught him about where assurance platforms quietly break.
What does the network assurance conversation keep missing beneath the dashboards and AI?
Most of the public conversation is about visibility, dashboards, and AI on top of the data. That part is real, but it skips over the layer underneath, which is whether the platform can actually carry the telemetry it is asking for. If you look at the survey data, only about 13% of collected telemetry is ever used, while enterprises spend close to a million dollars a year on observability tooling. That gap exists because teams are hauling data through pipelines that were never designed for current volumes, and the ingest, processing, and storage layers are quietly working harder every quarter to stay even.
The thing that gets missed is that performance engineering is no longer a polish step. It is the constraint that decides whether a platform can hold the workload at all. When a vendor says they monitor millions of devices, what they are really claiming is that their telemetry pipeline can absorb, normalize, route, and persist that traffic inside the latency budget operators expect. Most of the time, when an assurance platform feels slow or stale, the architecture is fine. The problem is concurrency, memory pressure, serialization cost, or a thread pool that was sized for a year ago.
After almost two decades across SAN, IP, and distributed assurance, what stays constant from one generation to the next?
It starts with one constant. Every five to seven years, the scale you are designing for shifts by an order of magnitude, and the architecture has to come along with it. My current work is on an enterprise assurance platform that covers around 18 million managed devices across more than 20,000 deployments, in environments like hospitals, airports, government agencies, and large campuses. Earlier in my career I worked on SAN and IP fabric management platforms that handled thousands of switches and hundreds of thousands of ports per deployment, which felt enormous at the time. The numbers change. The discipline does not.
Day to day, the work is a mix of three things. First, designing the ingestion and analytics pipeline so that it can carry multi-protocol telemetry from heterogeneous device fleets without buckling. Second, profiling the running system under realistic load and tracing the bottlenecks back to their actual cause, which is rarely where the dashboard says it is. Third, leading a team of seven engineers through the design and rollout work, because no single person can hold a system of that size in their head, and the architecture only survives if the team understands it the same way you do.
What architecture choices actually make it possible to carry telemetry from millions of devices into a single assurance pipeline?
The pipeline I work with ingests telemetry across several protocols at once: SNMP, NETCONF, REST polling, and streaming telemetry. Each has a different latency profile and a different failure mode. Buffering happens through Apache Kafka, stream processing is built on Apache Flink and Beam, and persistence is split across Elasticsearch, PostgreSQL, and MongoDB depending on the access pattern. None of those choices are exotic on their own. What is hard is making them cooperate cleanly when the volume keeps climbing and any one weak link backs up the whole pipeline.
The architectural principle I keep coming back to is that you have to push interpretation as close to ingestion as possible without coupling the two. If you bind health computation to the collector, you cannot iterate on it. If you defer everything until persistence, you have already lost the latency budget. The right shape is a structured, model-driven layer between the two, where new metrics, new device types, and new correlations can be added without touching the collection or storage code. Once that separation is real, you can scale each layer on its own terms, and the platform stops fighting itself.
What kind of failure does an otherwise clean architecture only reveal under production load?
The most useful failure modes are the ones that do not look like failures. They look like a system that is technically running but is slowly losing its latency budget. One I remember well involved telemetry aggregation across distributed microservices, where mean time to detect was sitting at 30 to 60 minutes and mean time to troubleshoot was 2 to 4 hours under heavy customer load. Operators were seeing alerts, but the path from raw signal to actionable health was too slow to be useful in mission-critical environments. Nothing was crashing. Everything was just late.
The work to bring that down was unglamorous and took months. We profiled the running JVM under realistic load, looked at thread dumps and heap snapshots, found contention in thread pools that nobody had revisited since the system was a quarter of its current size, and rebuilt the concurrency model around the actual access pattern. We tightened serialization, reduced memory footprint across services, and rewrote the aggregation logic to do less work per signal. Mean time to detect dropped to between 5 and 10 minutes, and mean time to troubleshoot dropped to under 1.5 hours. None of that work shows up on a feature roadmap. It is invisible until it is gone, and then the whole platform feels different.
If most collected telemetry never gets used, where is the waste actually coming from, and where is the fix?
It is a real problem, and the survey numbers are not exaggerated. The 2025 Sawmills report found that 70% of respondents said high log ingestion and indexing were the top contributor to runaway observability spend, with excessive trace volumes a close second at 50%. When only 13% of collected telemetry is being used, the rest is paying rent in your storage and processing layer for no operational return. That is a design failure, not a usage failure. Teams are instrumenting widely because they do not trust the platform to surface what matters, so they keep everything just in case.
My view is that the fix is upstream. You cannot fix telemetry waste at the dashboard layer, because by then the cost has already been paid. The fix is at the ingestion and modeling layer, deciding which signals carry health meaning, how they correlate, and which can be summarized or dropped without losing diagnostic value. That is closer to applied judgment than to engineering, and it is the part most platforms underinvest in. If you do that work, the storage bill goes down on its own. If you do not, no amount of cost optimization at the back end will catch up with the volume coming in.
What is the next real problem in assurance now that AI is being layered onto every platform?
AI is the obvious next layer, and Gartner has projected that AI-driven network management can reduce downtime by 50% and operational costs by 30% as adoption matures. Those numbers will land for some teams and not others, and the difference is going to be whether the underlying assurance pipeline is healthy enough to feed the AI good data. AI on top of a noisy, mistuned telemetry layer just produces faster bad decisions. The teams that invest in pipeline health first will get the gains. The teams that skip that step will be back at the same problem in two years with a more expensive bill.
What I am focused on is making the layer between telemetry and decision more model-driven, so that new device types, new metrics, and new correlations can be introduced without rebuilding the platform every time. I want the system to be able to absorb the next order-of-magnitude jump in scale without another rewrite, because the scale is coming whether the platform is ready or not. The performance engineering work, along with the cross-protocol ingestion work, is aimed at exactly that. The goal is a platform that can be trusted under load, and that the team can extend without holding their breath.
As assurance platforms move deeper into AI-driven operations, the engineering challenge is no longer limited to collecting telemetry at scale. It is about building systems resilient enough to sustain operational trust under continuously increasing load and complexity. Leaders like Irullappan Irulandi have spent years working at that boundary, where platform reliability is shaped not by architectural theory alone, but by the realities of production-scale performance, escalation response, and long-term operational durability.
Beyond his work in large-scale assurance platforms, Irullappan Irulandi has continued contributing to the broader engineering community through industry leadership and technical engagement. He was recently named a Hackathon Raptors Fellow, a recognition that reflects years spent working on distributed systems, telemetry scalability, and performance engineering under production conditions. Across nearly two decades in SAN, IP, and assurance environments, his perspective has been shaped not only by architectural design, but by operating systems through high-pressure escalation scenarios where reliability decisions carry immediate operational consequences. That combination of hands-on systems experience and broader technical contribution continues to inform how he approaches the next generation of scalable assurance infrastructure.
