🚀 Big Launch: ETF & Fund Reports for 50,000+ Assets (Now Live!)
A few weeks ago we shipped Stock Reports and the #1 request was: “Do this for ETFs and mutual funds.” Done. PinkLion now has deep-dive ETF/Fund Reports across 50k+ tickers fast, visual, and built for real decisions.
Access the reports: log in here → https://app.pinklion.xyz/accounts/login/
What’s inside each Fund Report?
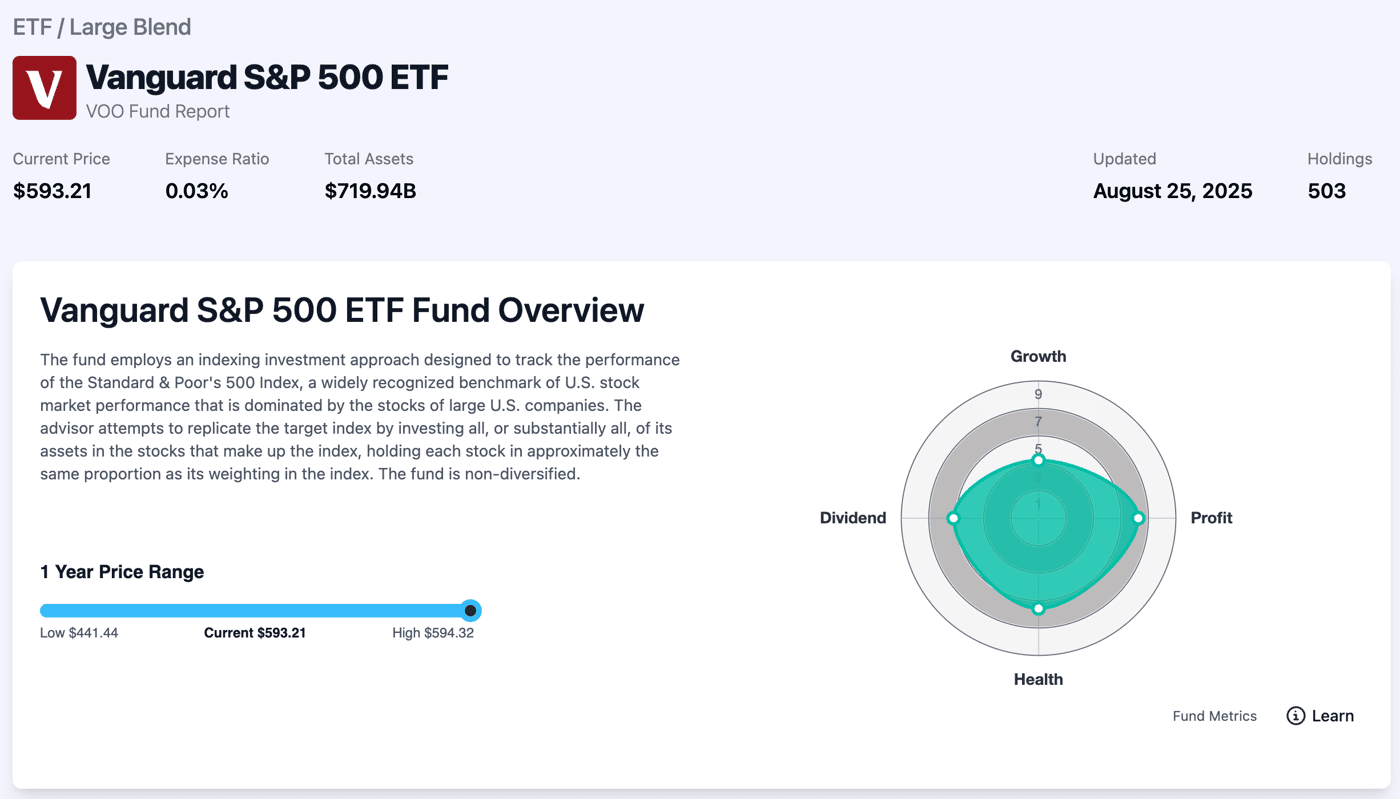
Overview at a glance: Price, expense ratio, AUM, holdings count, latest update, 1-year price range, returns, risk, and yield/valuation ratios.
Fund Scoring (0–10): Growth, Profit, Health, Dividend scores to orient you in seconds.
Price history: Clean long-term chart with quick drawdown cues and timeframe toggles.
Asset allocation: Stocks/bonds/cash/other with weights.
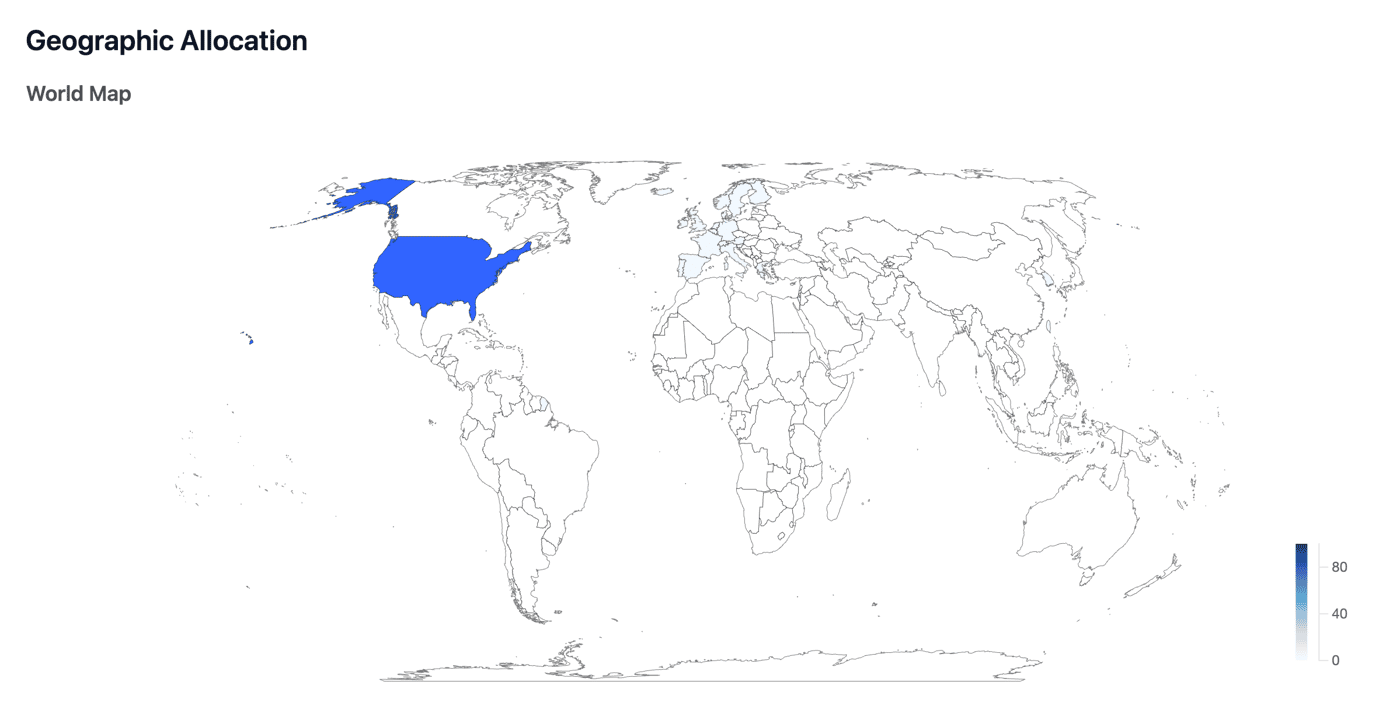
Geographic breakdown: Regions + country map to see home/overseas tilt instantly.
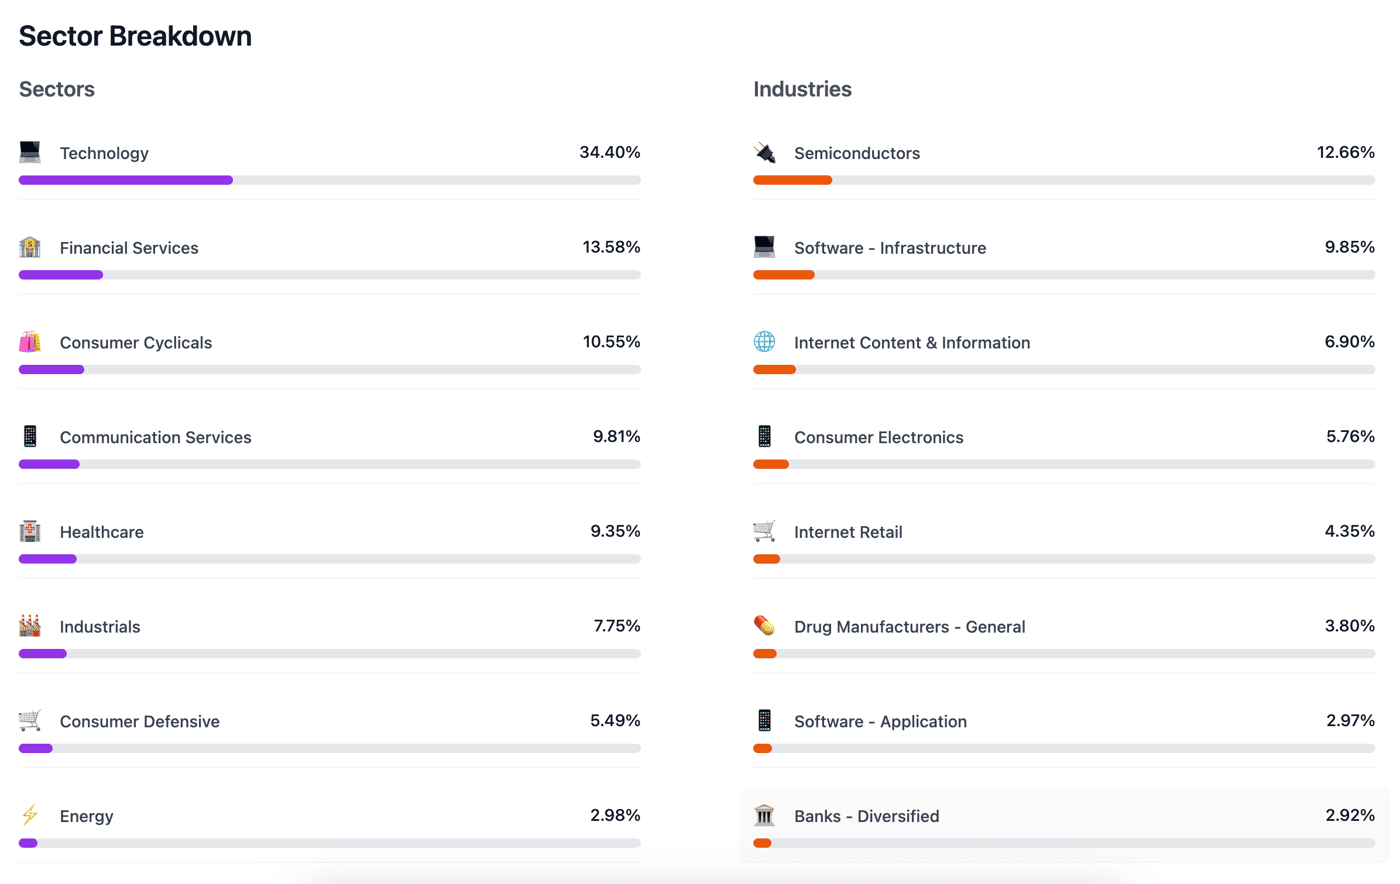
Sector breakdown: Drill into exposures (e.g., tech vs healthcare) with sortable weights.
Holdings transparency: Full constituents, not just the top 10 but all holdings, so you can spot overlap with what you already own.
Fund basics: Issuer, exchange, category, domicile, identifiers (ISIN/CUSIP) for clean record-keeping.
Why it matters
Allocation clarity: See exactly where your fund invests, no spreadsheet gymnastics.
Fee & risk checks: Expense ratio, volatility, beta, Sharpe, and yield in context.
Portfolio overlap: Full holdings make duplicate exposure obvious before you add another fund.
Zero learning curve: Same clean layout as our Stock Reports open, skim, decide.
Quick examples
Broad market: IVV, VOO, VTI • Tech tilt: QQQ, VGT • Dividend focus: VYM, SCHD
(All major ETFs and many mutual funds are covered.)
What’s next
Side-by-side Fund vs Fund comparisons